
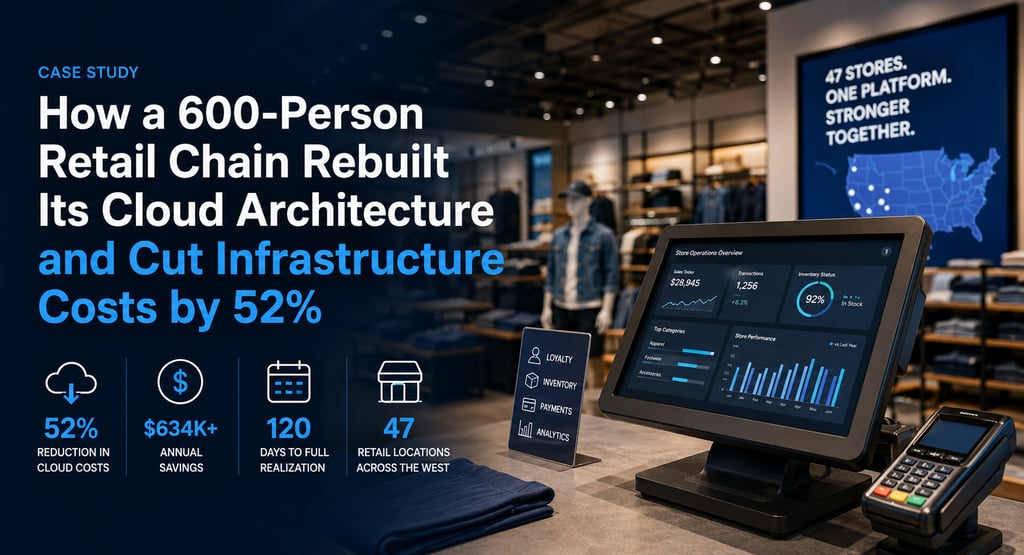
How a 600-Person Retail Chain Rebuilt Its Cloud Architecture and Cut Infrastructure Costs by 52%
5/21/20263 min read
Retail is one of the most infrastructure-intensive industries in the mid-market. A multi-location retail operation runs point-of-sale systems, inventory management platforms, customer loyalty applications, e-commerce infrastructure, loss prevention systems, and employee communications — all simultaneously, all with real uptime requirements, and increasingly all in the cloud. The result: cloud bills that grow in direct proportion to store count, often without anyone examining whether the architecture driving that growth is the most cost-effective option available.
The client in this case study operates 47 retail locations across the western United States, with a corporate headquarters and a regional distribution center. Total headcount at the time of engagement: approximately 600 employees. Monthly cloud spend: $94,200. Monthly infrastructure spend including managed services and telecom: $134,600. The trigger for the engagement was a board request for a full technology cost review as part of a margin improvement initiative ahead of a planned acquisition.
Retail technology environments are built layer by layer as the business grows — each new store, each new system, each new integration adding to a stack that was never architected holistically. The result is almost always the same: significant redundancy, significant waste, and a monthly bill that nobody in the organization fully understands.
The audit: mapping $134,600 in monthly infrastructure spend
We conducted a full Digital Plumbing Audit across all technology spend categories. The findings broke into four areas:
• Cloud compute and storage: $94,200 per month in AWS spend, of which the audit identified $31,400 in immediately addressable waste — idle development environments from the e-commerce platform relaunch 18 months prior, S3 storage in premium tiers for data accessed less than twice annually, and EC2 instances running at under 15 percent average CPU utilization for the point-of-sale analytics workload
• Managed services: $24,800 per month to an MSP for endpoint management and helpdesk services across all 47 locations — at a per-device rate that was 34 percent above current market for comparable scope. The MSP contract had auto-renewed twice without renegotiation
• Telecom and connectivity: $15,600 per month in store-level internet connectivity, with 31 of 47 locations still running legacy MPLS or bonded DSL circuits at pricing from 2020 to 2021 — an average of $340 per location per month versus current SD-WAN broadband alternatives averaging $140 per location
• Redundant SaaS subscriptions: $8,200 per month in identified SaaS redundancy — three separate project management platforms, two overlapping HR tools, and a business intelligence subscription covering capabilities already available in their existing Microsoft 365 licensing
The remediation plan
The remediation was sequenced in three phases to manage operational risk across the retail environment. Phase one, completed in 45 days: cloud right-sizing, S3 lifecycle policy implementation, and decommissioning of idle development environments. Monthly savings: $31,400. Phase two, completed in 90 days: MSP contract renegotiation using competitive bids from three alternative providers as Market Tape, achieving a per-device rate reduction of 28 percent. Monthly savings: $6,944. Phase three, completed over 120 days: progressive store connectivity migration from legacy circuits to SD-WAN broadband, prioritized by contract expiration dates to minimize early termination exposure. Monthly savings at full completion: $9,300. SaaS rationalization completed concurrently: $5,200 per month eliminated.
The financial outcome
Total monthly spend reduction: from $134,600 to $81,756 — a 39 percent reduction across all technology spend categories, or 52 percent reduction specifically on cloud infrastructure. Annual savings: $634,128. Implementation timeline: 120 days to full realization. The findings were incorporated into the board's margin improvement analysis, with the infrastructure savings contributing directly to EBITDA improvement that strengthened the company's acquisition valuation.
The CFO's comment at project close: "We knew there was waste somewhere. We did not know it was this much, or that it was this fixable in this timeframe."
What multi-location retailers need to understand
The technology cost profile of a multi-location retail operation is uniquely susceptible to the patterns above: store-by-store infrastructure decisions made without centralized architectural oversight, legacy connectivity contracts from pre-cloud-era pricing environments, and managed services relationships that predate the current competitive landscape. The combination almost always yields infrastructure spend that is significantly above what the current market offers.
If your retail operation has more than 10 locations and your technology cost structure has not been audited in the past 24 months, the pattern in this case study is likely familiar. Contact Sigma Technology Consulting at sigmatechconsult.com to discuss what a Digital Plumbing Audit looks like across a distributed retail environment.
Sigma Technology Consulting, Inc.
25 Years of Experience, Vetting & Procuring Technology Vendors
Contact Us
Support
© 2026. All rights reserved.